



The inventory turnover ratio is an important metric for ecommerce businesses that want to manage stock efficiently and maintain healthy cash flow. Whether you sell on Amazon, eBay, or Shopify, understanding how quickly your products sell can help you make better purchasing decisions and manage business finances.
This metric measures how many times a business sells and replaces its average inventory during a specific period. It helps ecommerce sellers evaluate product demand, identify slow-moving stock, and understand how efficiently inventory is being managed.
A low ratio may indicate excess inventory or slower product sales, while a high ratio can suggest that products are moving quickly. However, the right figure depends on your product category, customer demand, and business model.
Understanding this metric alongside cost of goods sold (COGS), operating expenses, and sales records can help you evaluate inventory performance and make more informed financial decisions.
What Is Inventory Turnover Ratio?
The inventory turnover ratio is a financial metric that measures how frequently a business sells and replaces its average inventory during a selected period.
For ecommerce sellers, it provides insight into how efficiently products move from available stock to completed sales. It can also help identify products that remain unsold for extended periods.
For example, a business with a higher ratio generally sells through its inventory more frequently than a business with a lower ratio.
This metric helps ecommerce sellers:
- Identify slow-moving products.
- Evaluate inventory purchasing decisions.
- Monitor how efficiently stock is being sold.
- Understand how much money remains invested in inventory.
- Compare inventory performance across different periods.
Tracking this figure regularly can help sellers understand whether their stock levels are aligned with actual customer demand.

How to Calculate Stock Rotation
To calculate the inventory efficiency ratio, divide the cost of goods sold (COGS) by the average inventory value for the same period.
Stock Movement Formula:
Stock Rotation Rate = Cost of Goods Sold (COGS) ÷ Average Inventory
You need two financial figures to perform this calculation.
1. Cost of Goods Sold (COGS)
COGS represents the direct cost of products sold during a specific accounting period. Depending on the business, it may include product purchase costs, manufacturing costs, and other directly attributable costs.
2. Average Inventory
Average inventory represents the average value of stock held during the selected period.
Use this formula:
Average Inventory = (Beginning Inventory + Ending Inventory) ÷ 2
Once you have both figures, divide COGS by average inventory to calculate the ratio.
For accurate results, use figures from the same accounting period and maintain consistent inventory valuation methods.
How to Calculate Average Inventory
To understand how to calculate average inventory, you need the beginning and ending inventory values for the selected accounting period. Add both amounts together and divide the total by two.
Average Inventory Formula:
Average Inventory = (Beginning Inventory + Ending Inventory) ÷ 2
For example, if your ecommerce business starts the year with $20,000 in inventory and ends with $30,000, the calculation will be:
($20,000 + $30,000) ÷ 2 = $25,000
Your average inventory value is $25,000. Use this amount to calculate your stock rotation rate for the year.
For businesses with significant seasonal stock fluctuations, averaging monthly inventory balances may provide a more representative figure than using only beginning and ending balances.
How to Calculate Stock Rotation Using a Formula and Practical Examples
Let’s consider an ecommerce seller who wants to calculate the inventory rotation rate for one year.
Suppose the business has the following financial figures:
- Beginning inventory: $20,000
- Ending inventory: $30,000
- Annual COGS: $100,000
Step 1: Calculate Average Inventory
Average Inventory = ($20,000 + $30,000) ÷ 2
Average Inventory = $25,000
Step 2: Calculate the Inventory Rotation Rate Using the Formula
Inventory Turnover Ratio = $100,000 ÷ $25,000
Inventory Turnover Ratio = 4
This means the seller sold and replaced an amount of inventory equivalent to their average inventory value four times during the year.
The result helps the business evaluate stock movement. However, sellers should compare it with previous periods and similar products to understand whether inventory performance is improving.

What Is a Good Inventory Rotation Rate for Ecommerce Businesses?
There is no universal ideal stock rotation rate for every ecommerce business. The right benchmark depends on product type, pricing, customer demand, supplier lead times, and purchasing patterns.
For example, sellers offering everyday household products may experience faster stock movement than businesses selling seasonal or specialized products.
Consider these general interpretations:
- Higher ratio: Inventory is moving relatively quickly, which may indicate strong demand and efficient purchasing.
- Lower ratio: Products may be selling slowly, or the business may be holding more stock than necessary.
- Changing ratio: A sudden increase or decrease may indicate changes in customer demand, purchasing activity, or sales performance.
A high ratio is not automatically better. If products sell faster than a business can replenish them, stockouts may occur and potential sales can be lost.
Instead of relying on a universal benchmark, compare your results over consistent periods and evaluate them alongside product availability and profitability.
What Factors Lead to a Low Stock Rotation Rate in Ecommerce Businesses?
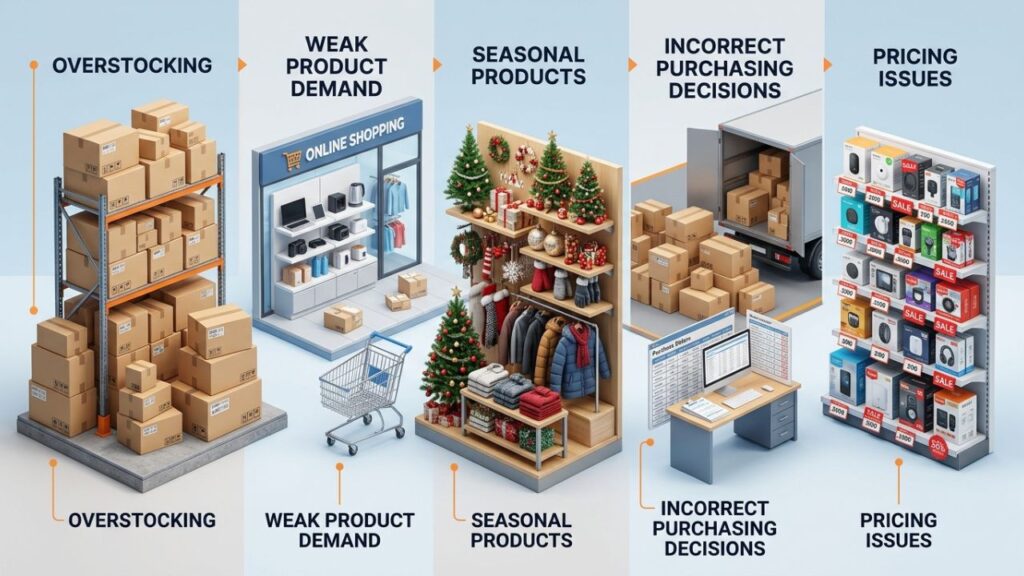
Several factors can cause inventory to move slowly in an ecommerce business. Identifying these issues can help sellers make better decisions about stock levels and purchasing.
1. Overstocking
Purchasing more products than customers are likely to buy can increase average inventory and reduce the ratio. Excess stock may also tie up cash that could otherwise support advertising, operations, or other business expenses.
2. Weak Product Demand
Products with limited customer interest may remain unsold for extended periods. Changes in market demand, pricing, and customer preferences can also affect sales.
3. Seasonal Products
Some products sell primarily during particular seasons or events. If sellers purchase too much inventory before a short selling period, remaining stock may reduce inventory efficiency after demand declines.
4. Incorrect Purchasing Decisions
Purchasing decisions based on incomplete sales or inventory records can lead to excess stock. Reviewing historical sales and product costs can help businesses make more informed purchasing decisions.
5. Pricing Issues
Products priced above customer expectations may experience slower sales. Sellers should evaluate pricing in relation to product costs, marketplace fees, shipping expenses, and desired profit margins.
How Inventory Turnover Affects Ecommerce Profit
The inventory turnover ratio is not just an inventory performance metric. It can also influence how ecommerce sellers manage cash flow and evaluate profitability.
When products remain unsold, money stays invested in inventory instead of being available for other business activities. Storage expenses, marketplace fees, and other operating costs may further affect the financial performance of the business.
Here are some important connections:
COGS and Profit Calculation
Accurate COGS records help sellers calculate the ratio and understand the direct cost of products sold. Incorrect product costs can make financial reports and profit calculations unreliable.
Inventory Carrying Costs
Holding inventory may involve storage, insurance, handling, and other expenses. These costs can reduce the overall profitability of products that take longer to sell.
Cash Flow Management
Buying inventory requires cash before products generate sales. Slow-moving stock can limit the funds available for restocking popular products or paying business expenses.
Product-Level Profitability
A product may generate regular sales but still deliver limited profit after COGS, marketplace fees, shipping, advertising, and other expenses are considered.
For this reason, sellers should review inventory performance alongside their complete financial records rather than relying on one metric alone.
How to Improve Stock Rotation and Manage Ecommerce Inventory More Efficiently
If you want to understand how to improve inventory turnover, start by reviewing your sales history, stock levels, and purchasing decisions. Ecommerce sellers can improve inventory performance by identifying slow-moving products, adjusting reorder quantities, and maintaining accurate product cost records.
The goal is to keep enough inventory available to meet customer demand without tying up excessive cash in unsold stock. The following strategies can help you manage inventory more efficiently.
1. Monitor Product Sales Regularly
Review sales data to identify products that sell consistently and those that remain unsold. This can help you adjust purchasing quantities according to actual demand.
2. Review Inventory Levels
Avoid purchasing large quantities without considering current stock and expected sales. Maintaining appropriate inventory levels can help reduce excess stock.
3. Identify Slow-Moving Products
Analyze products with limited sales activity and investigate possible reasons. Pricing adjustments, improved product listings, or promotional campaigns may help depending on the product and market.
4. Use Historical Sales Data
Compare sales across previous weeks, months, and seasons. Historical performance can help you estimate future demand and make more informed purchasing decisions.
5. Track COGS Accurately
Keep product purchase costs and other relevant direct costs properly recorded. Accurate COGS information supports more reliable inventory valuation, turnover calculations, and profit reporting.
6. Review Financial Performance
Monitor sales revenue, refunds, marketplace fees, operating expenses, and product costs together. This gives you a clearer picture of whether inventory is generating enough profit for your business.
How Bookkeeping Helps Track Inventory Costs
Accurate bookkeeping plays an important role in understanding inventory performance. Ecommerce sellers need reliable financial records to evaluate product costs, calculate COGS, and measure actual profitability.
When selling across multiple channels, keeping track of orders, refunds, marketplace fees, expenses, and settlements can become more complicated. Reviewing these figures separately may make it difficult to understand how inventory costs affect overall business performance.
PlugBooks helps ecommerce sellers organize financial information from supported sales channels, including Amazon, eBay, and Shopify. It supports bookkeeping workflows that help sellers track sales activity, expenses, fees, settlements, and COGS-related records.
With organized financial information, sellers can better evaluate product costs, review profitability, and make informed business decisions.

Frequently Asked Questions
1. What does the inventory turnover ratio tell you?
It shows how frequently a business sells and replaces its average inventory during a specific period. It helps evaluate stock movement and inventory management efficiency.
2. How Do You Calculate the Stock Turnover Ratio?
Divide the cost of goods sold by average inventory. The result represents how many times inventory turns over during the selected period.
3. Is a High Stock Turnover Ratio Good?
A high ratio can indicate strong sales and efficient stock movement, but it may also suggest insufficient inventory if products frequently run out of stock.
4. What Causes a Low Stock Turnover Ratio?
Common causes include overstocking, weak product demand, seasonal sales patterns, pricing issues, and inaccurate purchasing decisions.
5. Does Stock Turnover Affect Cash Flow?
Yes. Slow-moving stock keeps money tied up in unsold products, which can limit the cash available for other business expenses and purchases.
6. Why Is COGS Important When Calculating Stock Turnover?
COGS measures the direct cost of products sold. It is the main figure used in the stock turnover formula and helps sellers evaluate inventory movement using product costs rather than sales revenue.
